Climate Change: Structure
Transition Risks and Opportunities: Analysis results and financial impacts
Governance
MC recognizes climate change as a key management issue. Since initiating discussions in 2016 on the resilience of its businesses to climate change, MC has established and continues to strengthen internal mechanisms to integrate climate change and other ESG factors into decision-making across the MC Group. These efforts include initiatives aligned with the recommendations of the Task Force on Climate-related Financial Disclosures (TCFD), such as conducting climate scenario analyses, to support the development and execution of business strategies and operational planning.
Our Climate Governance Structure
MC’s approach to climate change, including related policies, is formulated and regularly reviewed by the Sustainability Committee, a subcommittee of the Executive Committee. In its deliberations, the Sustainability Committee takes into account advice and recommendations from external experts obtained through the Sustainability Roundtable. Matters deliberated by the Sustainability Committee are reviewed and approved by the Executive Committee, MC’s principal decision-making body. In accordance with the regulations governing the Board of Directors, these matters are reported to the Board of Directors on a regular basis (approximately three times per year), thereby ensuring an appropriate level of oversight.
In addition, Group Chief Sustainability Officers and Group Sustainability Managers are appointed within each business segment. These individuals are responsible for developing relevant management strategies, overseeing sustainability-related initiatives, including climate action, and strengthening climate-related initiatives and insight within their respective businesses. As a result, the above Basic Policy and Important Matters related to climate change are comprehensively considered in key business strategy decisions, as well as in the screening of new investment proposals.
Board of Directors, Executive Committee, and Sustainability Committee Deliberations and Reports
| Basic Policy on Climate Change | Covers climate-related initiatives across MC’s businesses, including climate-related disclosures. |
|---|---|
| Important Matters | Assessments of climate-related risks and business opportunities (including scenario analyses), the setting of GHG reduction targets, and progress toward achieving those targets. |
Climate-Change Governance Structure
| Board of Directors | Oversees MC’s climate-related actions and initiatives | Convenes approx. three times per year |
|---|---|---|
| Executive Committee | Decides MC’s basic policy on climate change Decides important matters related to climate change | Convenes approx. twice per year |
| Sustainability Committee (reports directly to the Executive Committee) | Deliberates on MC’s basic policy on climate change and related important matters, and reports findings to the Executive Committee | Convenes approx. once per year |
| Sustainability Roundtable | Shares expertise and engages in constructive dialogue on sustainability including climate change | Convenes approx. twice per year |
| Officer in Charge | Kenji Kobayashi (Director, Executive Vice President, Corporate Functional Officer, CSEO (concurrently) Capital Alliances) | |
| Department in Charge | Sustainability Department | |

Framework for identifying and managing climate-related risks and opportunities
MC implements the following initiatives to identify and manage climate-related risks and opportunities, including initiatives to achieve its GHG reduction targets.
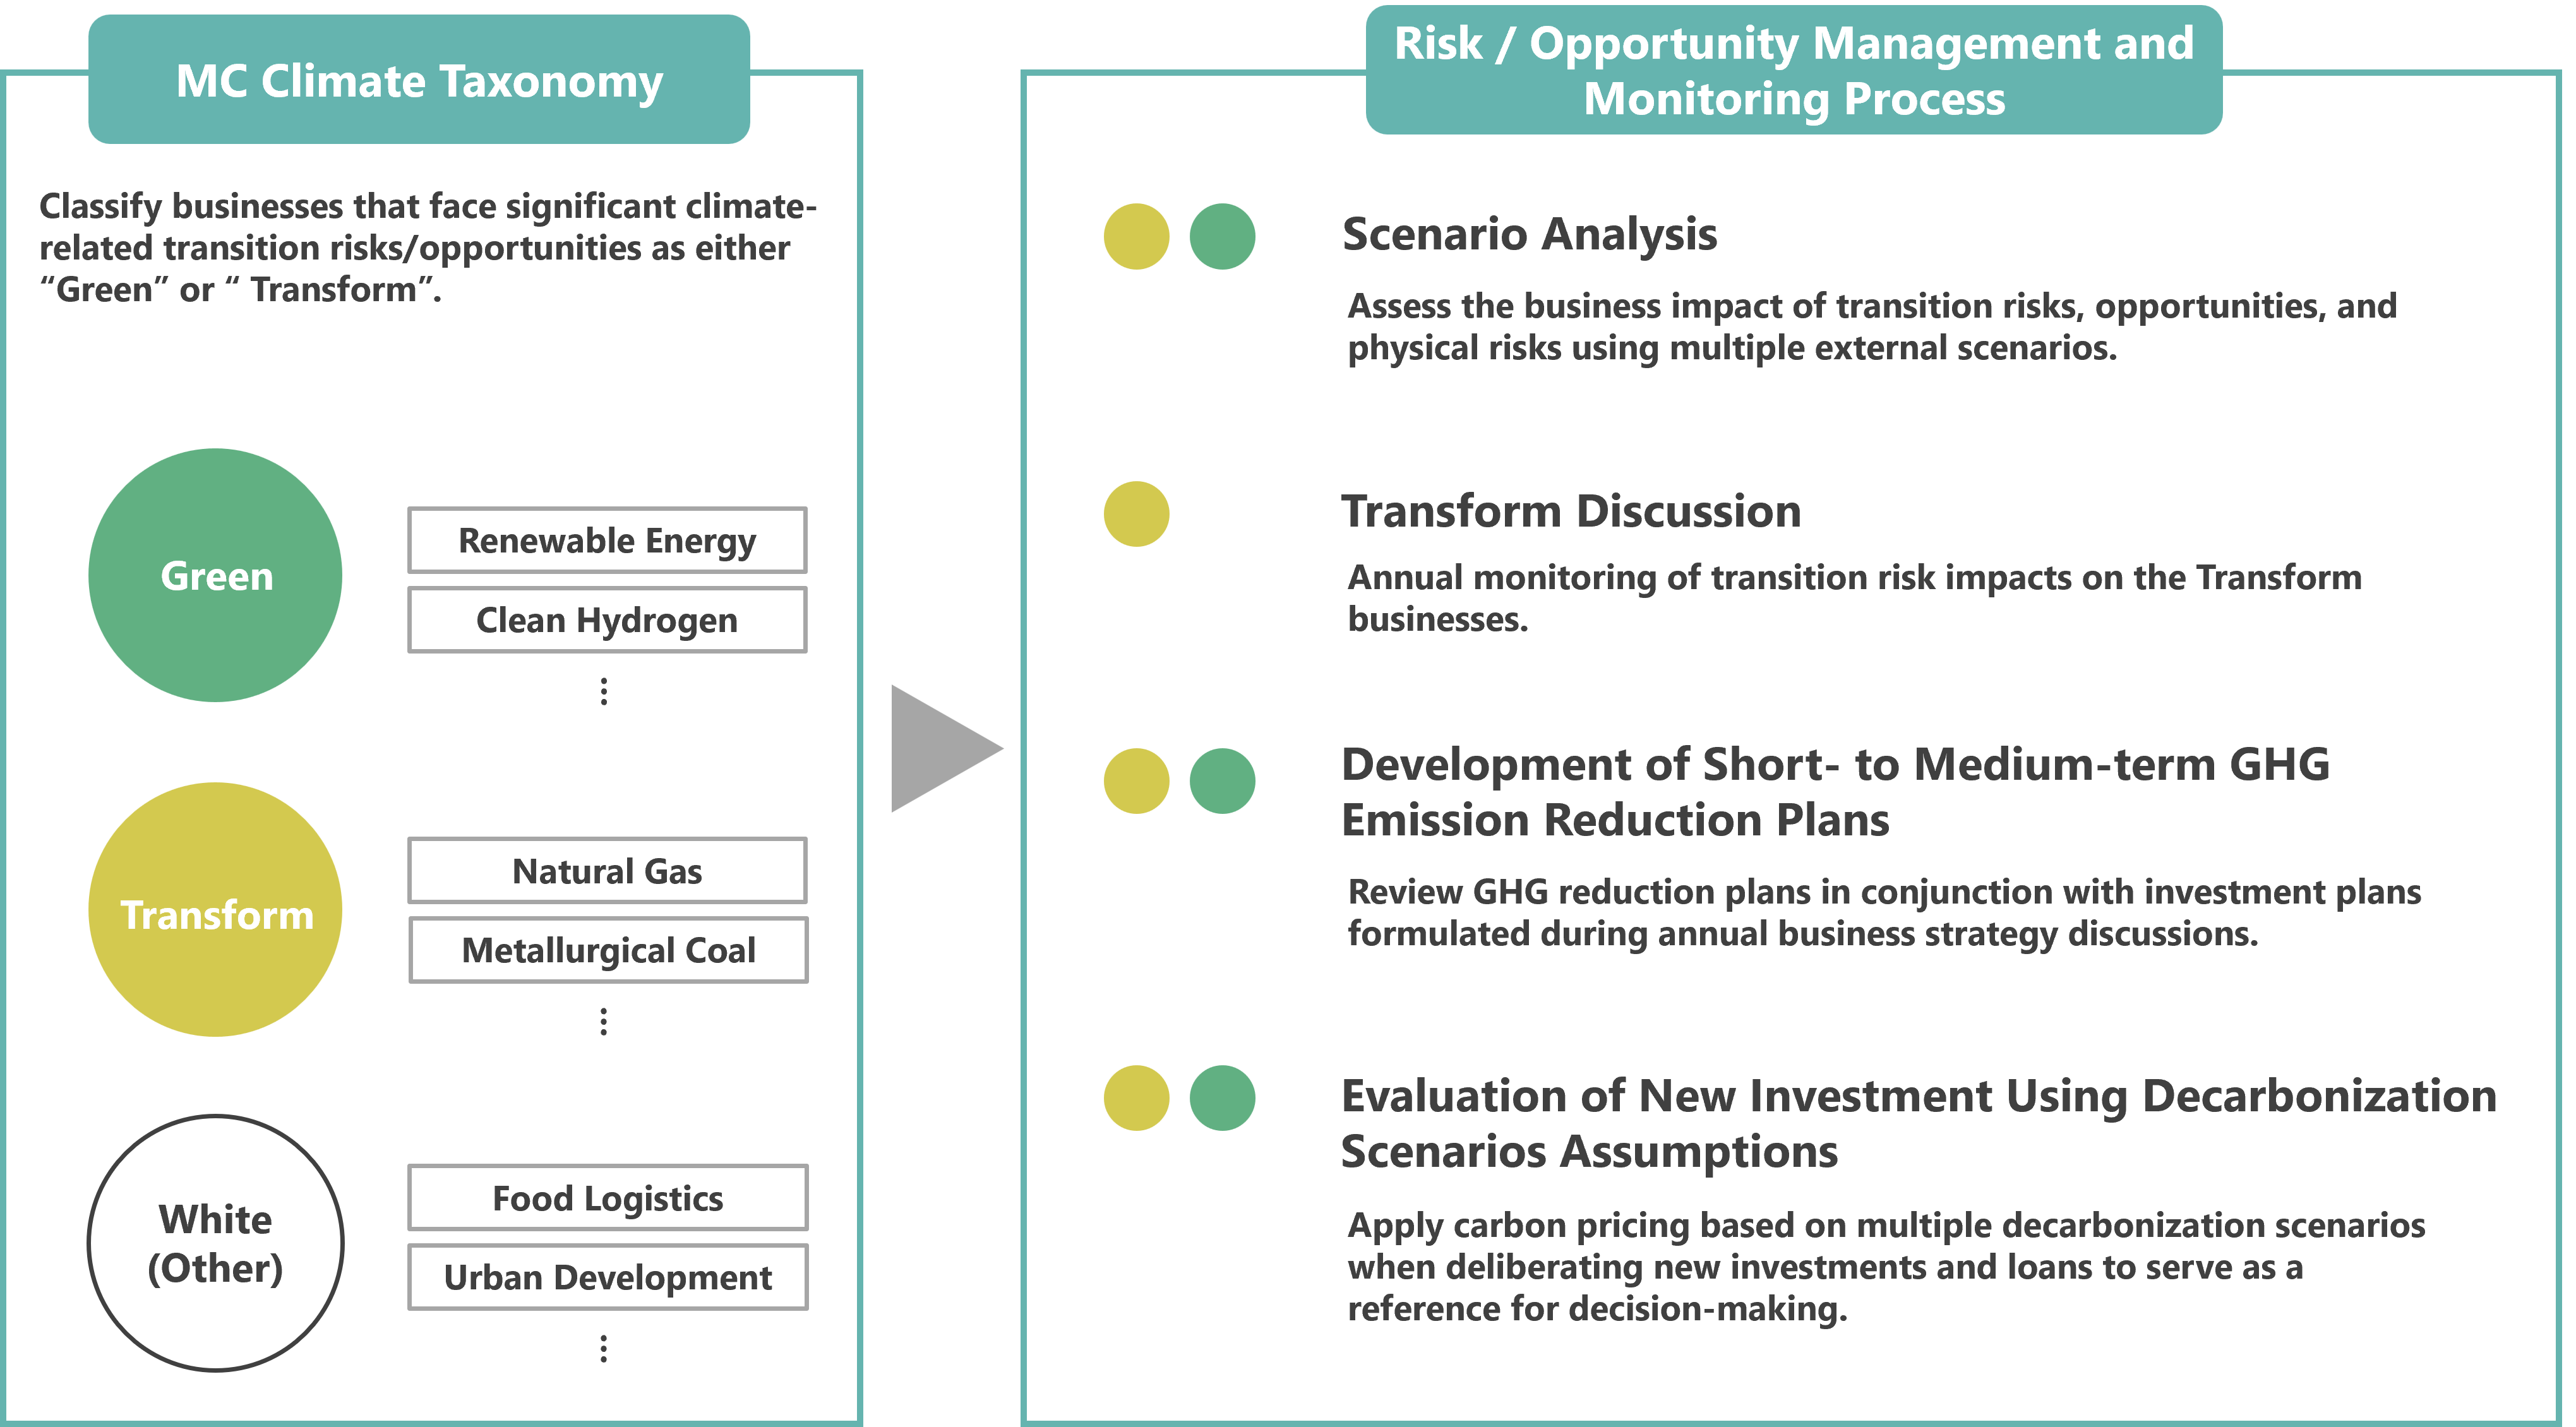
MC has introduced the MC Climate Taxonomy to classify and assess climate-related risks and opportunities across its businesses. The MC Climate Taxonomy applies to all business units and classifies businesses into three categories: Green, which includes businesses with significant climate-related transition opportunities; Transform, which includes businesses with significant climate-related transition risks; and White, which includes other businesses. In addition to developing investment plans aligned with its GHG reduction targets, MC identifies and manages climate-related risks and opportunities in ways tailored to the characteristics of each business. This is achieved through mechanisms such as scenario analyses, transformation discussions, and decarbonization profitability assessments for new investments, applied in accordance with the relevant business classification.
Classification process of the MC Climate Taxonomy
The classification process is illustrated in Figure 2. In identifying Transform businesses, MC considers both the volume of GHG emissions, including Scopes 1, 2 and 3, and the barriers to achieving GHG reductions. To assess specific reduction barriers, indicators such as Scope 1 6.5 emissions from unavoidable process-related gases and Scope 3 Category 11 emissions associated with the use of sold products are evaluated, with particular attention to the risk of stranded assets.

- *1Businesses for which demand under the 2.0℃ scenario in 2050 is projected to increase by 20% or more compared with current levels
- *2Industries initially identified as having high GHG emissions based on the EU Taxonomy. Other businesses are also classified in this category if they exhibit exceptionally high emissions relative to other industries, based on internal Scope 1 data and external Scope 3 Category 11 data.
- *3Classification determined based on GHG emissions, including Scope 1 and Scope 3 Category 11.
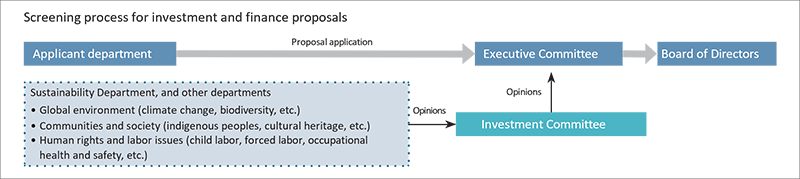
Screening Process for Investment and Financing Proposals
MC ensures that all investment and financing proposals submitted for review by the Board of Directors and the Executive Committee are first deliberated by the Investment Committee, a subcommittee of the Executive Committee. By including the General Manager of the Sustainability Department as a member of the Investment Committee, MC ensures that environmental and social considerations are comprehensively integrated into the screening and decision-making process. In addition to reviewing new proposals, the Investment Committee seeks to enhance the value of existing investees by monitoring their management practices and encouraging continuous improvement. From the perspective of climate-related transition risks and opportunities, as well as physical risks, the review and decision-making processes take into account quantitative data such as GHG emissions, together with relevant national policies and industry trends. Since August 2022, MC has conducted profitability assessments when screening new investment proposals involving Transform and Green businesses under the MC Climate Taxonomy, using indicators such as internal carbon pricing based on key assumptions derived from decarbonization scenarios.
Scenario Analysis for Climate-related Risks and Opportunities
As part of our efforts to mitigate climate change-related risks and capture related opportunities, MC continuously conducts scenario analyses using external climate scenarios. Through these analyses, we identify medium- to long-term transition risks and opportunities, as well as physical risks associated with climate change, and have established a framework that enables these factors to be incorporated into business strategy formulation and investment decision-making.
In FY2025, we conducted a scenario analysis, the results of which are outlined below. We will continue to update this analysis as appropriate in response to material changes in our businesses or in the scenarios referenced, as well as in line with each management cycle.
Transition Risks and Opportunities
1. Scenario analysis process
(1) Selection of scenarios
In this analysis, we primarily referenced the International Energy Agency (IEA)’s World Energy Outlook (WEO), one of the most widely used international scenarios and a benchmark employed by a diverse range of stakeholders, including national governments, companies, and financial institutions. WEO provides comprehensive quantitative data on energy supply and demand, energy and carbon prices, and energy-related CO₂ emissions by country/region and sector. We consider it to offer a highly consistent and objective analytical foundation for assessing our diversified business portfolio across multiple sectors.
Specifically, we adopted two scenarios from IEA WEO 2025: STEPS (Stated Policies Scenario) and NZE (Net Zero Emissions by 2050 Scenario). STEPS is a forecast-type scenario that reflects current policies as well as officially announced policy intentions and targets and is therefore suitable for evaluating more realistic future risks and opportunities based on current policy trends. In contrast, NZE is a back-cast scenario that assumes extremely ambitious and rapid global decarbonization toward achieving the 1.5°C goal. While this scenario entails significant hurdles to realization, it is useful for evaluating risks and opportunities under the most advanced transition pathway to a decarbonized society.
By using these two scenarios with different underlying assumptions, we consider a range of possible futures depending on the extent of policy progress and the speed of societal decarbonization and analyze them both quantitatively and qualitatively.
For climate-related policies, macroeconomic trends, and other assumptions in each scenario, please refer to WEO 2025.
(2) Selection of Businesses Covered by the Analysis
Business operations across a global footprint, we prioritize for inclusion in our scenario analysis those businesses considered to be particularly significantly affected by climate change–related risks and opportunities.
Specifically, based on MC Climate Taxonomy, our proprietary business classification developed with reference to concepts such as the EU Taxonomy, we selected natural gas/LNG and steelmaking coal from among the businesses classified as “Transform Business”*1 as those covered by the transition risk analysis. This selection reflects their relatively large impacts on MC’s financial performance, as measured by factors such as outstanding investments and loans, net profit, and asset size.
- *1Businesses with high GHG emissions and relatively high difficulty in reducing emissions.
With respect to transition opportunities, from among the businesses classified as “Green Businesses”*2 under the MC Climate Taxonomy, we selected Copper and Renewable Energy for analysis, taking into account their relatively large impacts on MC’s financial performance based on factors such as investments, net profit, and asset size. - *2Businesses expected to grow in a decarbonized society.
(3) Analytical steps
- First, we analyzed the external environment surrounding each business under STEPS and NZE using frameworks such as PEST analysis and Porter’s Five Forces. This enabled us to organize baseline assumptions for each scenario, including market structure, competitive environment, and policy trends. In addition, for transition risks, we identified climate-related risks and opportunities that could affect each business, also considering key factors identified through our ongoing Transform Discussion process.
- Next, based on each business’s business model and value chain, we assessed which parts of the value chain would be affected by the identified risks and opportunities, and in what manner.
- Finally, based on the above analyses, we quantified financial impacts for items where scenario assumptions and our financial information could be applied, and conducted qualitative assessments for other items.
2. Analysis results and financial impacts on MC
Our scenario analysis is intended to examine potential changes in future business environments from multiple perspectives and to enhance understanding of climate change-related risks and opportunities that could affect our businesses. It is not intended to provide a specific forecast of the future or a projection of our performance. Each scenario contains numerous uncertainties and assumptions, and actual events—including pathways for reducing GHG emissions—may differ materially from those indicated by the scenarios. Accordingly, the results of this analysis do not precisely predict future financial impacts and are positioned as reference information to understand the directionality of risks and opportunities.
Based on these assumptions, we describe below the scenario analysis results and financial impacts for each business.
(1) Natural Gas / LNG Business
MC promotes natural gas/LNG business primarily in the Asia-Pacific region, contributing to the stable supply of LNG by strengthening existing business foundations and developing new projects in traditional LNG-producing countries such as Brunei, Malaysia, Indonesia, and Australia, as well as through LNG offtake operations. In the Americas, MC is engaged in natural gas/LNG businesses— including LNG projects in the U.S. and Canada, gas marketing in North America, and shale gas development in Canada —as well as new LNG project development, marketing, optimization, and trading leveraging its asset base, and LNG vessel businesses (ownership, chartering, and operation management). Given that Natural Gas/LNG plays a wide range of roles during the transition to a carbon-neutral society—such as complementing the intermittency of renewable energy, serving as an energy source for sectors that are difficult to electrify, and functioning as feedstock for next-generation energy—MC positions the natural gas/LNG business as an important domain for achieving both a carbon-neutral society and sustainable economic development.
Based on this understanding, we examined the business environment outlook, transition risks for our Natural Gas/LNG business, and our policies/initiatives in response under each scenario, as outlined below.
① Business environment analysis
Under the IEA’s STEPS scenario, medium-term global natural gas demand is assumed to decline in advanced economies such as the EU, while increasing in emerging economies. By 2035, global natural gas demand is projected to increase by approximately 12% compared with 2024, and supply by approximately 11%. Global LNG trade volumes are projected to increase by approximately 46%, driven particularly by strong demand in Asia. Over the longer term, a shift toward low-emissions gases (biogas/biomethane) is assumed to progress further, mainly in advanced economies, and with increasing renewable energy, global natural gas demand and supply in 2050 are assumed to decline by approximately 3% compared with 2035.
Under the IEA’s NZE, in the medium term, demand is assumed to shift from conventional natural gas toward low-emissions gases, while renewable energy and battery costs are expected to decline. Global natural gas supply is assumed to decrease by approximately 38% compared with 2024, and by approximately 67% compared with 2035 in the longer term.
② Impacts on MC’s business, including financial impacts
In evaluating decarbonization impacts on the natural gas/LNG business, we identified a decline in natural gas/LNG demand due to factors such as the expansion of renewable energy as the key issue. To quantify this impact, we focused on natural gas/LNG demand trajectories under each IEA scenario and conducted supply-demand simulations across multiple cases using forecast values for 2030 and 2050 under STEPS and NZE.
*This analysis is a scenario analysis conducted under specific assumptions and does not represent a future forecast or MC’s business plan.
Based on the analysis in 1, if FY2024 revenue results were adjusted using the same increase/decrease ratios as the natural gas/LNG demand assumptions in each IEA scenario, the estimated impact on revenue under STEPS would be approximately +15% in 2030 (vs. 2024) and +29% in 2050 (vs. 2024). Under NZE, the estimated impact would be approximately −6% in 2030 (vs. 2024) and −76% in 2050 (vs. 2024).
We also consider future developments related to the expansion of emissions trading schemes and the introduction of carbon taxes to be important factors. Based on IEA scenarios, potential increases in carbon prices and stricter regulations—including incremental costs associated with expanded emissions trading and carbon taxation, as well as carbon intensity regulations on shipping*—are expected to accelerate decarbonization in fuel transportation. Incorporating these factors, this analysis estimates impacts on FY2024 revenue results of approximately +10% in 2030 and +20% in 2050 under STEPS, and approximately −10% in 2030 and −90% in 2050 under NZE.
In this analysis, FY2024 revenue results were adjusted using natural gas/LNG demand increase and decrease ratios from each IEA scenario and did not take into account factors such as future price fluctuations or changes in supply volumes. These factors could materially affect actual earnings. Accordingly, these estimates are scenario-based calculations under specific conditions and do not represent a future forecast or MC’s business plan.
- *The International Maritime Organization (IMO) revised its initial strategy on GHG emission reductions adopted in 2018 and adopted the 2023 IMO Strategy on Reduction of GHG Emissions from Ships in July 2023, which sets a target of net-zero total GHG emissions from international shipping by around 2050.
③ Future policies and initiatives
Natural gas/LNG is an important energy source during the transition period. While the NZE scenario used in this analysis anticipates a long-term decline in natural gas/LNG demand, medium- to long-term demand growth is expected, particularly in Asia, which is a strategic region for our LNG business. Based on this view, MC will aim to achieve both a stable supply of energy and resources and the decarbonization/low-carbon transition of social and economic activities by focusing on strengthening the resilience of the LNG business while simultaneously advancing the decarbonization/low-carbonization of the LNG value chain, as described below. Over a longer horizon, we will assess the business environment, including technological innovation and government policy trends, further advance decarbonization/low-carbonization initiatives for the LNG business, optimize our LNG portfolio, and invest in next-generation energy fields.
[Strengthening the resilience of the LNG business]
We will enhance competitiveness through improved production efficiency and cost reductions, while continuously considering portfolio optimization.
For new LNG projects, we will make investment decisions with potential stranded asset risks in mind should decarbonization accelerate rapidly.
[Decarbonization/low-carbonization of the LNG value chain]
In parallel with strengthening LNG business resilience, we will leverage our position and strengths as one of Japan’s largest LNG players to promote CCUS that contributes to decarbonizing/low-carbonizing the LNG value chain itself. We will also capture business opportunities such as the production and supply of next-generation energy, including blue hydrogen, thereby playing a role in the transition to a decarbonized society.
(2) Steelmaking Coal Business
MC, through Mitsubishi Development Pty Ltd (MDP), which develops, produces, and sells various resources in Australia as a platform for MC’s mineral resources business, engages in BMA, one of the world’s largest steelmaking coal suppliers, with its partner, BHP Group plc. BMA operates an integrated system of five mines and port facilities producing high-quality, cost-competitive steelmaking coal used as a key raw material for steelmaking coke. Nearly all steelmaking coal produced by the BMA operations is exported via seaborne trade.
Steel, as a fundamental material underpinning industrial activity, is expected to continue to see solid demand as it supports economic growth across countries while also serving as an essential material for infrastructure development required for decarbonization.
As pig iron production in China—which currently accounts for approximately 60% of global output—is expected to decline, production in emerging economies such as India and Southeast Asia is projected to expand. Unlike China, India and Southeast Asian countries rely on imports for their supply of steelmaking coal, and seaborne trade volumes are therefore expected to be supported by demand from these regions.
At present, large-scale low-carbon or decarbonized steelmaking methods have not been established, and widespread global adoption is expected to require substantial time. While electric arc furnace (EAF) steelmaking, which has relatively lower GHG emissions, may expand, constraints remain, including limited scrap supply and technical challenges in producing high-grade steel. Hydrogen-based direct reduced iron (DRI), which is attracting attention as an alternative to conventional blast furnace methods, faces challenges such as commercial-scale operation, the production and procurement of green hydrogen, and the development of hydrogen supply networks. Technical and economic hurdles remain, and large-scale commercial deployment is not expected in the short term. Accordingly, blast furnace steelmaking using steelmaking coal is expected to remain the mainstream during the transition period.
Based on these assumptions, we examined the business environment outlook, transition risks for our steelmaking coal business, and our policies and initiatives in response under each scenario, as outlined below.
① Business environment analysis
Under STEPS, while China’s steel production is expected to peak, growth in India and Southeast Asia is expected to drive an increase in global steel production from 1,883 Mt in 2024 to 2,407 Mt in 2050. Meanwhile, through measures such as the adoption of direct reduced iron and expanded scrap use in steel production supported by existing policies, global CO₂ emissions from the steel industry in 2050 are expected to be about 10% lower than in 2024.
In the medium term, carbon prices are expected to remain low, and conventional blast furnace steelmaking is expected to remain overwhelmingly cheaper than low-carbon or decarbonized steelmaking, implying that the transition will take time. Even in the long term, while the shift toward low-carbon steelmaking is expected to progress, blast furnace steelmaking is expected to remain to some extent, and demand for steelmaking coal is expected to decline gradually.
Under NZE, thorough material efficiency improvements, such as longer building lifetimes, product lightweighting, and reduced manufacturing losses, together with progress in the circular economy through higher recycling rates, are assumed to create “decoupling,” whereby new steel production does not increase even with economic growth. As a result, global steel production is assumed to increase only slightly from 2024 to 2050. Supported by high carbon prices and policy measures, 2030 targets set by net-zero initiatives in the steel sector—targets not achieved under STEPS—are assumed to be achieved globally. As a scenario backcast from the 1.5°C goal, NZE assumes strong international cooperation, including accelerated investment in technology development and cross-border market creation such as mandatory procurement of green steel. By 2050, hydrogen-based direct reduced iron is assumed to account for 30% of steel production and iron ore electrolysis for 10%, with maximized scrap use further expanding the role of EAFs, while blast furnace steelmaking is assumed to shrink substantially. However, blast furnace methods are assumed to remain to some extent, including through the expansion of processes with CCUS.
② Impacts on MC’s business, including financial impacts
In evaluating the impacts of decarbonization on our steelmaking coal business, we recognize the progress and diffusion of new steelmaking technologies that do not use coal as a key factor shaping the future of the steel industry. To quantify these impacts, we focused on changes in global crude steel production and the share of EAFs, and conducted simulations across multiple cases for 2030 and 2050 under STEPS and NZE to assess how different transition pathways affect steelmaking coal demand.
*This analysis is a scenario analysis that estimates business impacts under certain conditions and is not a future forecast; it differs from our business plan.
Based on IEA assumptions, under STEPS in 2030 global crude steel production is expected to increase by about 6% compared with 2024, while the blast furnace share is expected to decrease by about 6%, resulting in a gradual decline in steelmaking coal demand. By 2050, crude steel production is expected to increase by about 28% versus 2024, but blast furnace-based production is expected to decrease by about 25%, leading to further contraction in steelmaking coal demand. Under NZE, while crude steel production remains broadly flat, the EAF share increases significantly and the blast furnace share declines sharply. By 2030, the blast furnace share decreases by more than 10% versus 2024 and steelmaking coal demand declines markedly. By 2050, the blast furnace share decreases by more than 30% versus 2024 and steelmaking coal demand contracts substantially.
We also consider future developments in Australia’s emissions regulations, including the current Safeguard Mechanism, where we operate, as an important factor. Based on IEA scenarios, we simulated the impact of potential increases in additional costs related to emissions trading and credit procurement under the Safeguard Mechanism, taking into account possible changes in carbon prices and tighter regulations, and assuming procurement costs for Australian Carbon Credit Units (ACCUs). Under STEPS, we assumed ACCU prices rise annually by the CPI change rate plus 2%, starting from the 2025 actual value of AUD 36/t, based on current rules. Under NZE, we assumed carbon prices surge through strengthened regulation of industrial emissions, with ACCU prices rising to the advanced-economy CO₂ price in IEA WEO 2025 (USD 250/t in 2050).
Based on these assumptions, while a decline in revenue is expected, the estimated impact on our FY2024 revenue results is approximately no impact in 2030 and a few percent decrease in 2050 under STEPS, and around −10% in 2030 and around −40% in 2050 under NZE, even when considering additional costs from emissions trading.
In addition to the above risk factors, trends such as increasing complexity in environmental permitting processes for coal development projects, strengthening GHG reduction targets in the steel industry, and enhanced climate measures by governments, such as advisory opinions on state obligations regarding climate change issued by the International Court of Justice, suggest accelerated decarbonization across the steel industry. MC will monitor these policy and regulatory developments closely and reflect them in our business strategy.
However, at present, we do not have sufficient supporting information to reasonably quantify their financial impacts, and therefore we monitor them as general trends rather than calculating quantitative impacts.
This analysis does not consider factors such as future price fluctuations or changes in steelmaking coal supply volumes, which could materially affect actual earnings. In addition, steel and blast furnace-based steel products are expected to remain indispensable for social infrastructure and decarbonization-related infrastructure for some time. Even if decarbonization were to accelerate rapidly, if carbon prices and similar costs are passed through to final product prices and accepted by consumers and markets, increased steelmaking coal costs could be reflected in prices. This could influence long-term supply-demand structure and price formation, potentially slowing demand declines or even contributing to demand increases. The estimates presented here do not incorporate such factors and evaluate a scenario in which steelmaking coal demand is reduced based on climate change parameters alone; mitigating effects from future price formation or market adjustments are not considered. Accordingly, these estimates are scenario-based calculations under specific conditions and do not represent a future forecast or our business plan.
③ Future policies and initiatives
While the steel industry is expected to undergo a prolonged transition period, high-quality steelmaking coal—the main product of the BMA business—is expected to see relatively stronger demand than lower-quality coal, as it can contribute to lower-carbon blast furnace steelmaking processes. At the same time, due to resource scarcity and increasing development challenges such as more complex permitting requirements, new mine investment is expected to slow further, and supply of high-quality steelmaking coal is expected to decline. Through the BMA business, which holds globally scarce high-quality coal assets, MC will continue to contribute to stable supply in response to steel demand growth in various countries and to the steel industry’s decarbonization and low-carbonization.
MC is also actively promoting GHG emission reductions, and within the BMA business we are considering and advancing initiatives such as renewable energy procurement, methane management, and diesel substitution. For example, BMA plans to switch 100% of the electricity used at mines to renewable energy by 2027.
In addition, together with our partner BHP, major steelmakers, and major engineering companies, we have concluded collaboration agreements to jointly conduct demonstration tests of CO₂ capture technologies at steelworks, among other initiatives, to reduce GHG emissions across the entire steel value chain.
MC will also advance its EX strategy in the minerals business through three lenses: decarbonization, electrification, and the circular economy. In addition to decarbonizing the steel value chain, we will strengthen initiatives related to copper and battery materials essential for electrification, as well as recycling businesses.
(3) Copper Business
MC owns and operates world-class copper mines primarily in South America, including Chile and Peru. For operating assets, we hold interests of 8.25% in the Escondida mine (Chile), 5% in the Los Pelambres mine (Chile), 20.44% in Anglo American Sur S.A. (including Los Bronces mine, among others), 40% in the Quellaveco mine (Peru), and 10% in the Antamina mine (Peru). To maintain and expand production, we acquired a 30% interest in Copper World (U.S.), an undeveloped copper mine, and also invested approximately 4% in the Marimaca copper project (Chile).
Copper has excellent electrical conductivity and is used as an essential material across a wide range of industrial applications and daily life, including electrical systems and appliances. Demand is expected to remain resilient as the global population grows and economies expand. In addition, as electrification progresses, renewable energy and EV adoption—which are essential for decarbonization—are expected to accelerate further, while the rapid diffusion of generative AI is expected to drive additional demand through expanded data center construction.
On the supply side, declining ore grades and other factors are expected to reduce production from existing mines. While increases in supply from new mine development and scrap-derived copper will be required to offset these declines, hurdles to new mine development are rising due to more complex permitting and other challenges. As a result, the copper market is expected to become increasingly tight over the medium to long term.
Based on these assumptions, we examined the business environment outlook, transition opportunities for our copper business, and our policies and initiatives in response under each scenario, as outlined below.
① Business environment analysis
According to copper demand forecasts under the STEPS scenario in the IEA’s Global Critical Minerals Outlook 2025, total copper demand is projected to increase from 26.7 Mt in 2024 to 31.3 Mt in 2030 and 37.5 Mt in 2050. Copper demand is expected to remain robust, supported by fundamental demand. Under the assumption that countries steadily implement already announced policies, renewable energy deployment and EV adoption are expected to progress at a moderate pace over the medium to long term, leading to steady expansion in copper demand. Meanwhile, supply-side constraints are expected to intensify due to increasing difficulty in developing new mines.
Under NZE, which assumes achievement of net-zero emissions by 2050, more rapid progress in renewable energy deployment and EV adoption than under STEPS is required, and copper demand is expected to accelerate further over the medium to long term. As a result, the copper market is expected to tighten further. Under the NZE scenario in the same report, copper demand is projected to reach 34.4 Mt in 2030 and 41.3 Mt in 2050.
② Impacts on MC’s business, including financial impacts
In evaluating climate change impacts on our copper business, we recognize increased copper demand driven by progress in renewable energy deployment and EV adoption as the key factor shaping the business’s future. This analysis evaluates the impact of demand-side drivers on our earnings under the assumption that there are no constraints on primary supply. To quantify this impact, we conducted simulations using copper demand growth rates in 2030 and 2050 under STEPS and NZE, based on IEA scenarios, to assess how different transition pathways affect earnings from the copper business.
*This analysis is a scenario analysis that estimates business impacts under certain conditions and is not a future forecast; it differs from our business plan.
For evaluation purposes, we assume that MC continues to maintain and expand production at existing assets as we work to secure and stably supply copper resources essential for a low-carbon or decarbonized society, and that we can obtain opportunities to participate in new mine and expansion projects accompanying demand growth while broadly maintaining our market share. Under these assumptions, we estimate a revenue growth opportunity in proportion to increasing copper demand.
Copper demand has historically expanded on the back of strong fundamental demand. Over the past decade (2014–2024), copper demand has already experienced growth comparable to the increase projected under the STEPS scenario by 2030, at approximately +20% compared with 2024 levels. During the same period, LME copper prices rose by more than 30%, and amid expected supply constraints, copper prices are assumed to remain resilient going forward. Copper is a listed commodity traded on the London Metal Exchange (LME) and the Commodity Exchange (COMEX) in New York, and its prices are therefore subject to financial market influences. Nevertheless, as in the past, the potential for increased revenues driven by higher prices is also anticipated.
Based on these assumptions, relative to FY2024 revenue results, under STEPS—where renewable energy deployment and EV adoption progress moderately under the assumption that already announced policies are steadily implemented—our copper business is estimated to have revenue growth opportunities of approximately +20% in 2030 and +40% in 2050, in proportion to copper demand growth. Under NZE—where renewable energy deployment and EV adoption accelerate rapidly toward net-zero by 2050—copper demand growth significantly exceeds that under STEPS, and revenue increases of approximately +30% in 2030 and +50% in 2050 are expected.
This analysis is based on third-party projections and represents an estimate under specific conditions; it does not represent our future forecast or business plan.
③ Future policies and initiatives
As we face the major societal challenge of climate change, our minerals business is shifting toward a portfolio strategy based on societal needs. In particular, copper demand is expected to increase steadily worldwide, driven by decarbonization and electrification, while tightening supply-demand conditions are anticipated. To ensure stable supply in response to this demand growth, MC aims for further growth through internal expansion of existing assets, acquisition of high-quality assets, and utilization of new technologies.
(4) Renewable Energy Businesses
- Tomaximize the utilization of renewable energy, MCbuilds a power value chain by integrating functions to produce power, balance supplyand demand, and supply electricityto customers, and undertakes various initiatives to meet diverse customerneeds.
In Europe, we use integrated energy company Eneco as our platform and develop a wide range of businesses centered on the Netherlands, Belgium, and Germany, including the development and operation of renewable energy power sources, power trading, and retail electricity sales. In the Americas, we promote distributed solar power generation and energy storage businesses to accelerate renewable energy adoption and strive to enhance corporate value by providing solutions to challenges across the power value chain. In Asia and Oceania, we provide decarbonization solutions to diverse customers through renewable energy power development and hydrogen-related business development, working toward realization of a carbon-neutral society. In Japan, we develop and operate renewable power generation assets such as solar, onshore wind, and hydropower, and provide customer solutions utilizing such power, contributing to realization of a carbon-neutral society by 2050 as advocated by the government.
- While decarbonization trends differ by region, globalelectricity demand is expected to increase, driven by the development ofgenerative AI, progress in electrification, and changes in industrial andsocial structures. MC views renewable energy as an important business domainthat can meet these supply expectations while supporting both a carbon-neutralsociety and social and economic activities. To meet customers’ decarbonizationneeds, we provide solution-oriented services that add value across our powergeneration, supply-demand balancing, and electricity supply functions.
Based on these assumptions and our track record, we examined the business environment outlook, transition opportunities for our renewable energy businesses, and our policies and initiatives in response under each scenario, as outlined below.
① Business environment analysis
Under STEPS, many renewable energy-related policies are assumed to be adopted globally. In the EU, coal-fired power phase-out plans announced by member states are assumed to be achieved by each country’s earliest target year. In the U.S., state-level renewable energy deployment targets are assumed to be sustained and strengthened beyond their initial deadlines. In Japan, the Seventh Strategic Energy Plan indicates expanding renewable energy to 40–50% by 2040. Toward 2050, global renewable energy shares are assumed to rise further due to continued declines in power generation costs and infrastructure development, including a 75% expansion of transmission grids compared with 2024. As a result, global renewable energy generation is expected to grow at an average annual rate of 5.5% from 2024 to 2050.
Under NZE, annual investment in the global power sector and renewable energy capacity is assumed to double compared with 2024, and renewable energy is assumed to account for 70% of global energy supply. With further strengthened infrastructure compared with STEPS, including expanded battery installations and transmission grid expansion, renewable energy generation is assumed to grow at an average annual rate of 7.9% from 2024 to 2050.
② Impacts on MC’s business, including financial impacts
In evaluating decarbonization impacts on our renewable energy businesses, we recognize global electricity demand trends and the expansion of renewable energy shares as key factors. As these directly affect profitability and investment decision-making, we conducted simulations using renewable energy market growth rates in 2030 and 2050 under STEPS and NZE, focusing on changes in renewable energy markets to assess how different transition pathways affect renewable energy demand.
*This analysis is a scenario analysis that estimates business impacts under certain conditions and is not a future forecast; it differs from our business plan.
Based on growth rates in renewable energy markets across regions where we operate—Europe, the U.S., Asia and Oceania, and Japan—the analysis estimates that under STEPS, revenue from our renewable business will increase to approximately 1.5 times 2024 levels by 2030 and to more than twice 2024 levels by 2050 as the market expands. Under NZE, with strengthened decarbonization policies and accelerated renewable deployment, our renewable business is expected to have revenue growth to more than twice 2024 levels by 2030 and more than five times 2024 levels by 2050. In addition, particularly in Europe and Japan, subsidy and tax incentive schemes to promote renewable deployment are in place, and further expansion or strengthening of such support may occur as decarbonization policies progress.
While IEA’s STEPS assumes implementation of existing policies and officially stated policy intentions and targets, achieving those assumptions involves constraints such as grid limitations, regulatory frameworks and their implementation, and infrastructure development. Accordingly, renewable deployment and market expansion may not necessarily progress as assumed. Moreover, this analysis does not separately incorporate variables such as power price trends, competitive dynamics, foreign exchange fluctuations, changes in policies and regulatory regimes, material price changes, or supply chain constraints. The purpose of this analysis is to understand the direction and relative magnitude of potential impacts from differences in climate scenarios; it does not represent our business plan.
③ Future policies and initiatives
The deployment of renewable energy and batteries can vary significantly by country and region depending on policy and regulatory conditions and technological innovation, and their timing and pace may differ materially. Through renewable energy businesses that contribute to societal decarbonization, supply-demand management to address renewable intermittency, and power trading businesses including spot and forward transactions in electricity markets, MC aims to simultaneously realize a decarbonized society and respond to increasing global electricity demand.
Specifically, in Europe, we will contribute to the decarbonization transition and reduced environmental burdens through further growth of Eneco, an integrated energy company that has advanced renewable development ahead of peers. In the Americas, we will continue advancing renewable power generation businesses to address supply-side challenges amid growing electricity demand, while closely monitoring policy and regulatory developments. In Asia and Oceania and Japan, we will build power value chains encompassing development and operation of renewable energy power sources, supply-demand balancing, and retail electricity, taking into account each country or region’s regulatory environment and market characteristics, with the aim of contributing to a sustainable low-carbon or decarbonized society and enhancing corporate value.
Physical Risks
1. Scenario Analysis Process
(1) Selection of Scenarios
To understand the impacts that climate change–related physical risks, both acute and chronic, may have on our businesses, we conduct physical risk analysis by referring to the internationally used Shared Socioeconomic Pathways (SSPs). The SSPs are future scenarios developed by the international research community, centered on the Intergovernmental Panel on Climate Change (IPCC), and provide a framework for assessing future climate change through socioeconomic assumptions such as demographic trends, economic growth, technological progress, and greenhouse gas emissions.
Among these scenarios, we primarily refer to the high-emissions pathway SSP5-8.5 and the lower-emissions pathway SSP2-4.5. SSP5-8.5 assumes a future in which global emissions reductions do not progress sufficiently and is useful for understanding the potential for physical risks to materialize under more severe climate change impacts. In contrast, SSP2-4.5 assumes a future in which warming is constrained and is suitable for understanding risk-mitigation effects where mitigation measures are effective.
Using these scenarios in combination with climate models and hazard datasets, we assess the likelihood of events such as floods, storm surges, heatwaves, and droughts under different levels of future climate change and identify vulnerabilities at major business sites.
(2) Selection of Businesses Covered by the Analysis
We recognize that climate change–related physical risks are not limited to specific businesses but may affect a broad range of our activities. Changes in the frequency and severity of natural hazards, including floods, storm surges, heatwaves, droughts, and typhoons, have the potential to impact operations and supply chains across diverse business domains, including energy and resources, manufacturing, logistics, infrastructure, and food-related businesses.
Accordingly, our physical risk analysis is not limited to businesses covered by the transition risk analysis. Instead, we selected a broader set of businesses accounting for approximately 70% of our portfolio, measured primarily using financial and non-financial information, and conducted the analysis across this wider scope.
(3) Analytical Steps
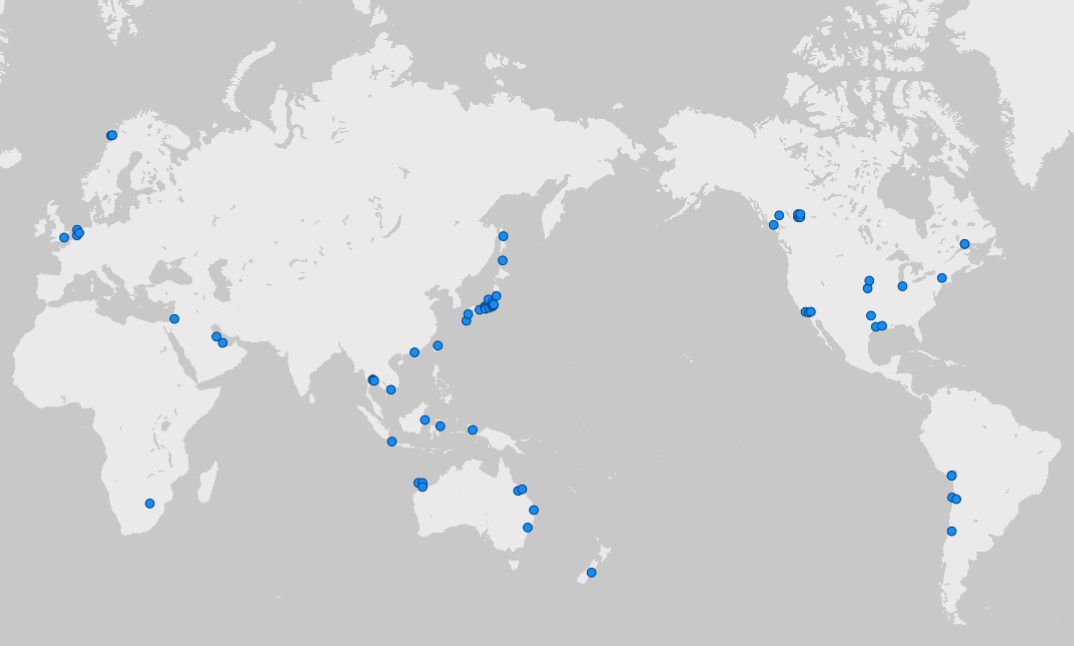
- For consolidated subsidiaries, local entities, and investee companies included in the analysis, we selected business-critical sites based on factors such as asset value and potential impacts on production and operations. For entities primarily engaged in trading, we selected sites where key suppliers are located, taking into account transaction volumes.
In total, 82 critical sites were selected for analysis.
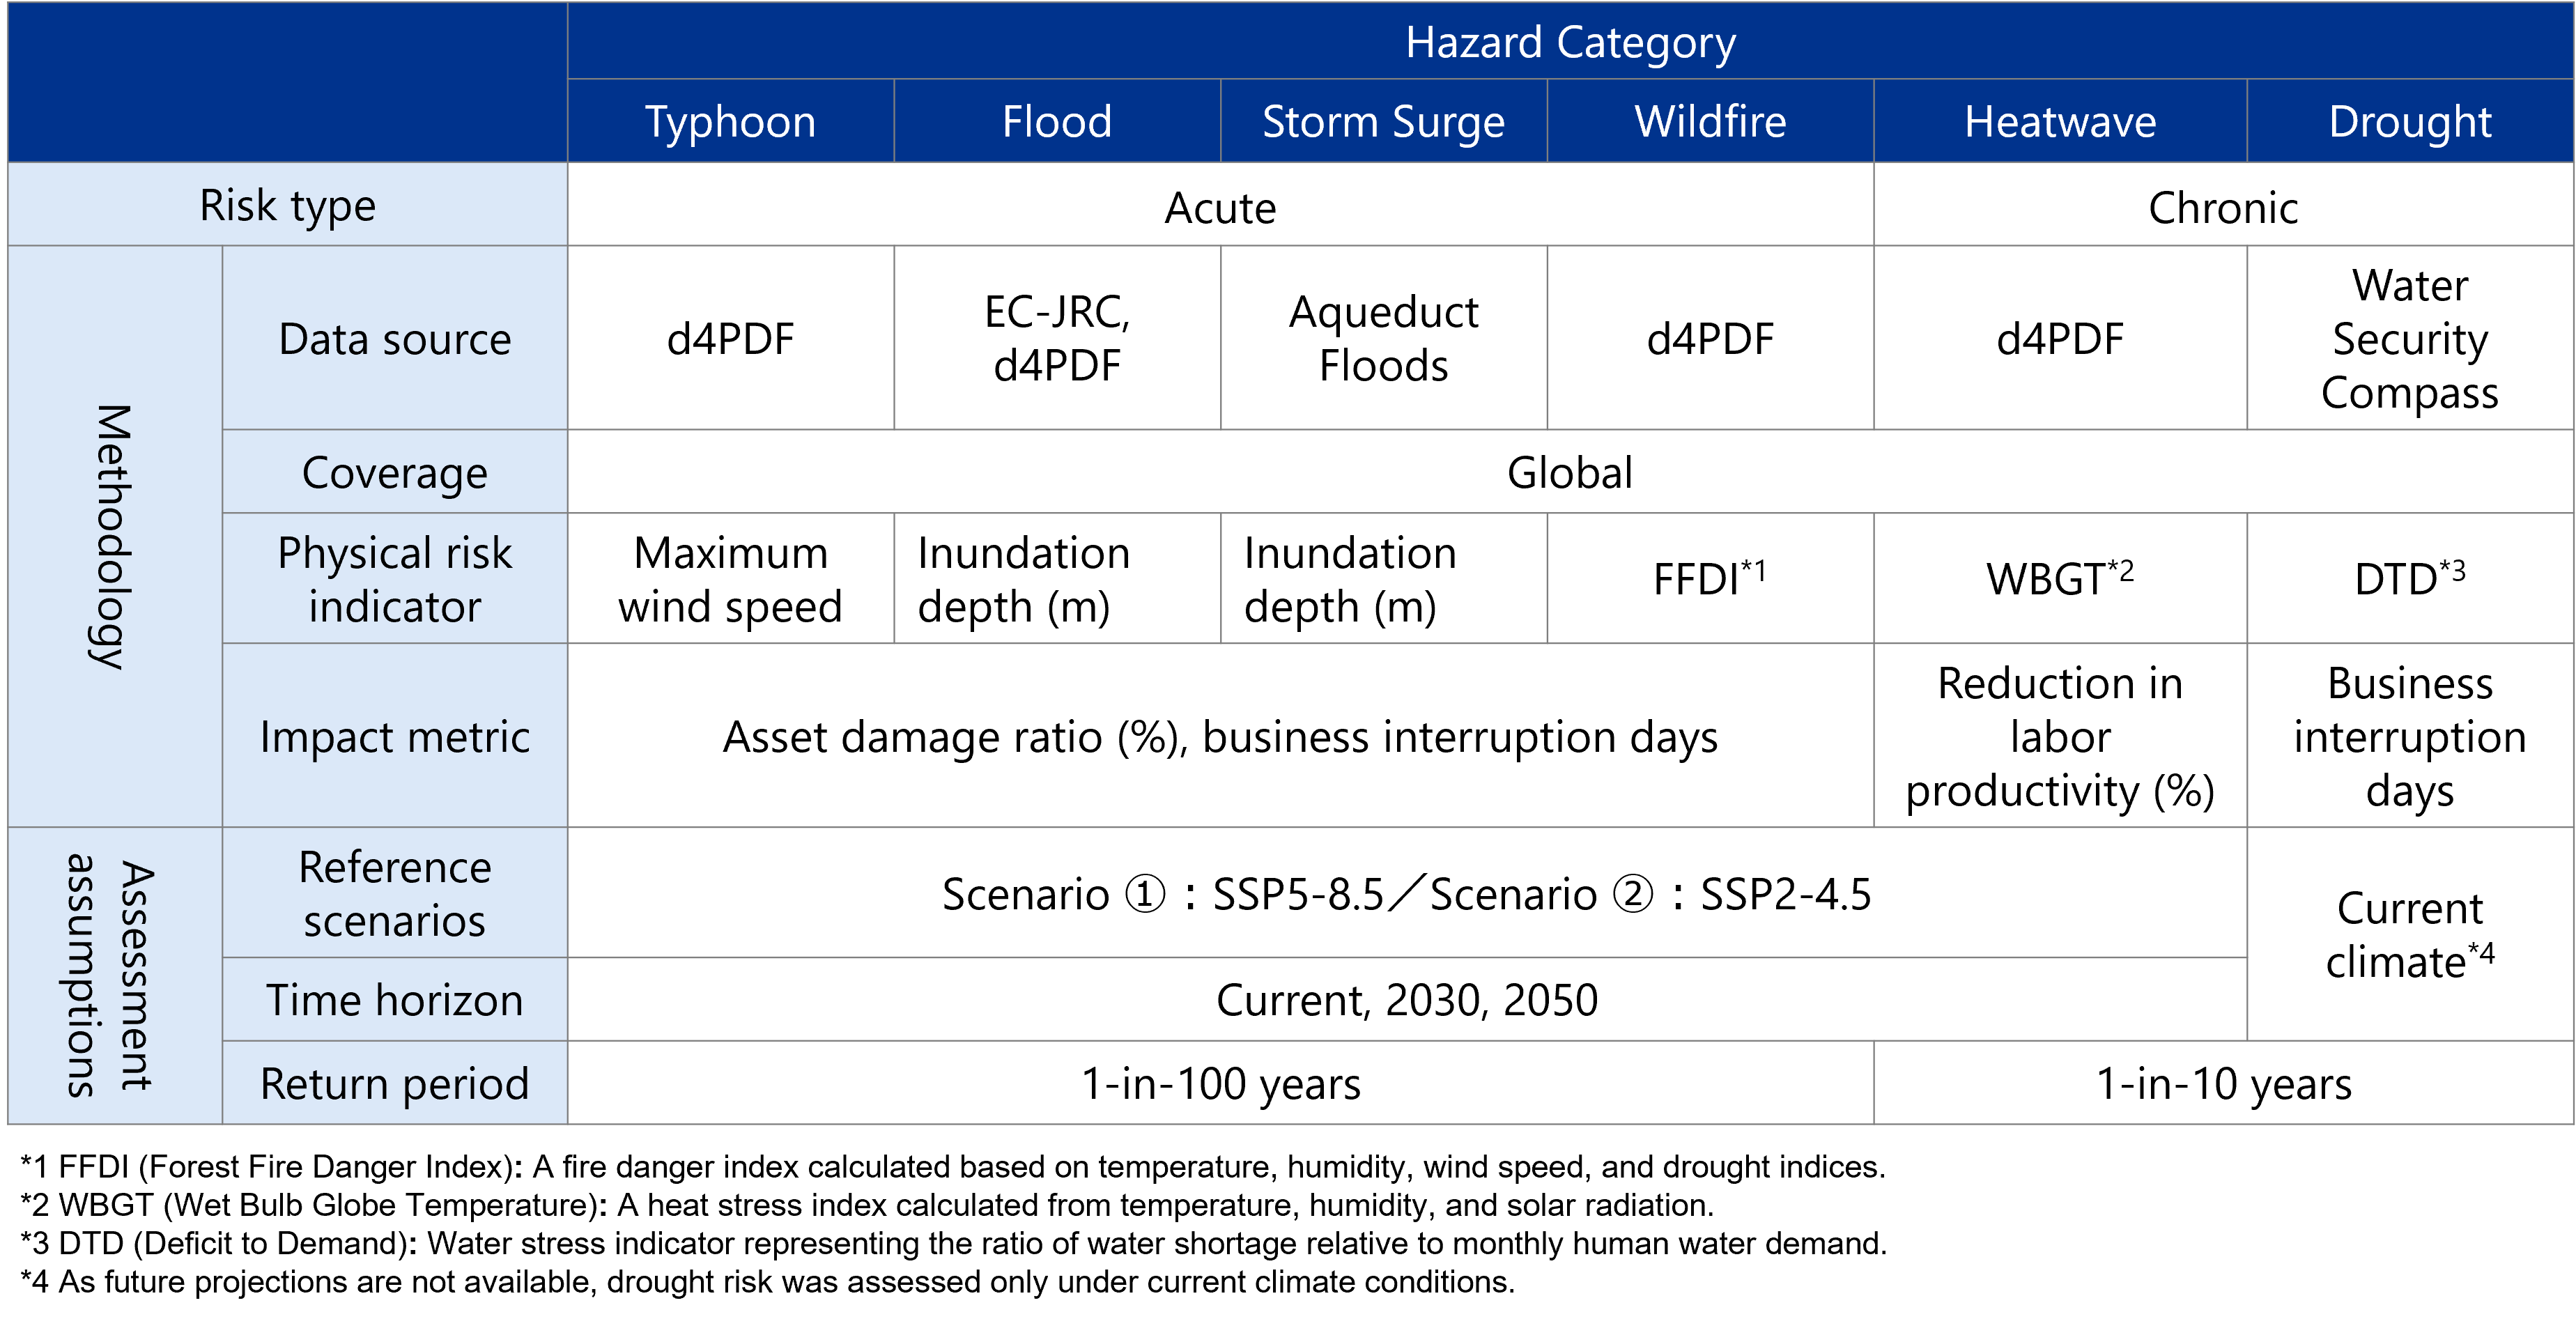
- For each site, based on SSP5-8.5 and SSP2-4.5, we assessed acute risks, including windstorms, floods, storm surges, and wildfires, and chronic risks, including heatwaves and water stress (drought). Acute risks were evaluated assuming a return period of once in 100 years, while chronic risks were evaluated assuming a return period of once in 10 years. Acute risks, though less frequent, can have significant impacts when they occur and therefore require evaluation over longer return periods. Chronic risks occur more frequently and on a more persistent basis, and extending the return period is not expected to result in materially different risk assessments. Accordingly, they were evaluated using a relatively shorter return period. Details of the analytical methods and assumptions are described below.
- Based on information such as asset values and revenues for sites assessed as having high acute or chronic risks, we estimated quantitative financial impacts at each site using physical risk assessment models that incorporate future climate simulation data and historical statistical data.
2. Analysis Results and Financial Impacts on MC
Our physical risk analysis is intended to understand the potential impacts of future climate change and does not present specific forecasts of future conditions or estimates of actual damage. It should be noted that there are inherent scientific uncertainties in precisely predicting the future frequency, intensity, and geographic distribution of climate-related hazards.
At this stage, there are limitations in the resolution and consistency of climate models and hazard data, as well as in methodologies for quantifying impacts at the individual business-site level. Accordingly, this analysis is based on the latest available data and reasonable assumptions and does not accurately predict future financial impacts. Rather, it is positioned as reference information to assess the directionality of risks.
In evaluating the financial impacts of physical risks in this analysis, we classified impacts primarily into: (i) impacts on asset values arising from damage to facilities and equipment and the associated recovery costs due to natural disasters, and (ii) impacts on revenues arising from operational disruptions and supply constraints. In addition, for heatwaves, impacts are organized mainly in terms of personnel costs, reflecting factors such as deteriorating working conditions and declines in labor productivity.
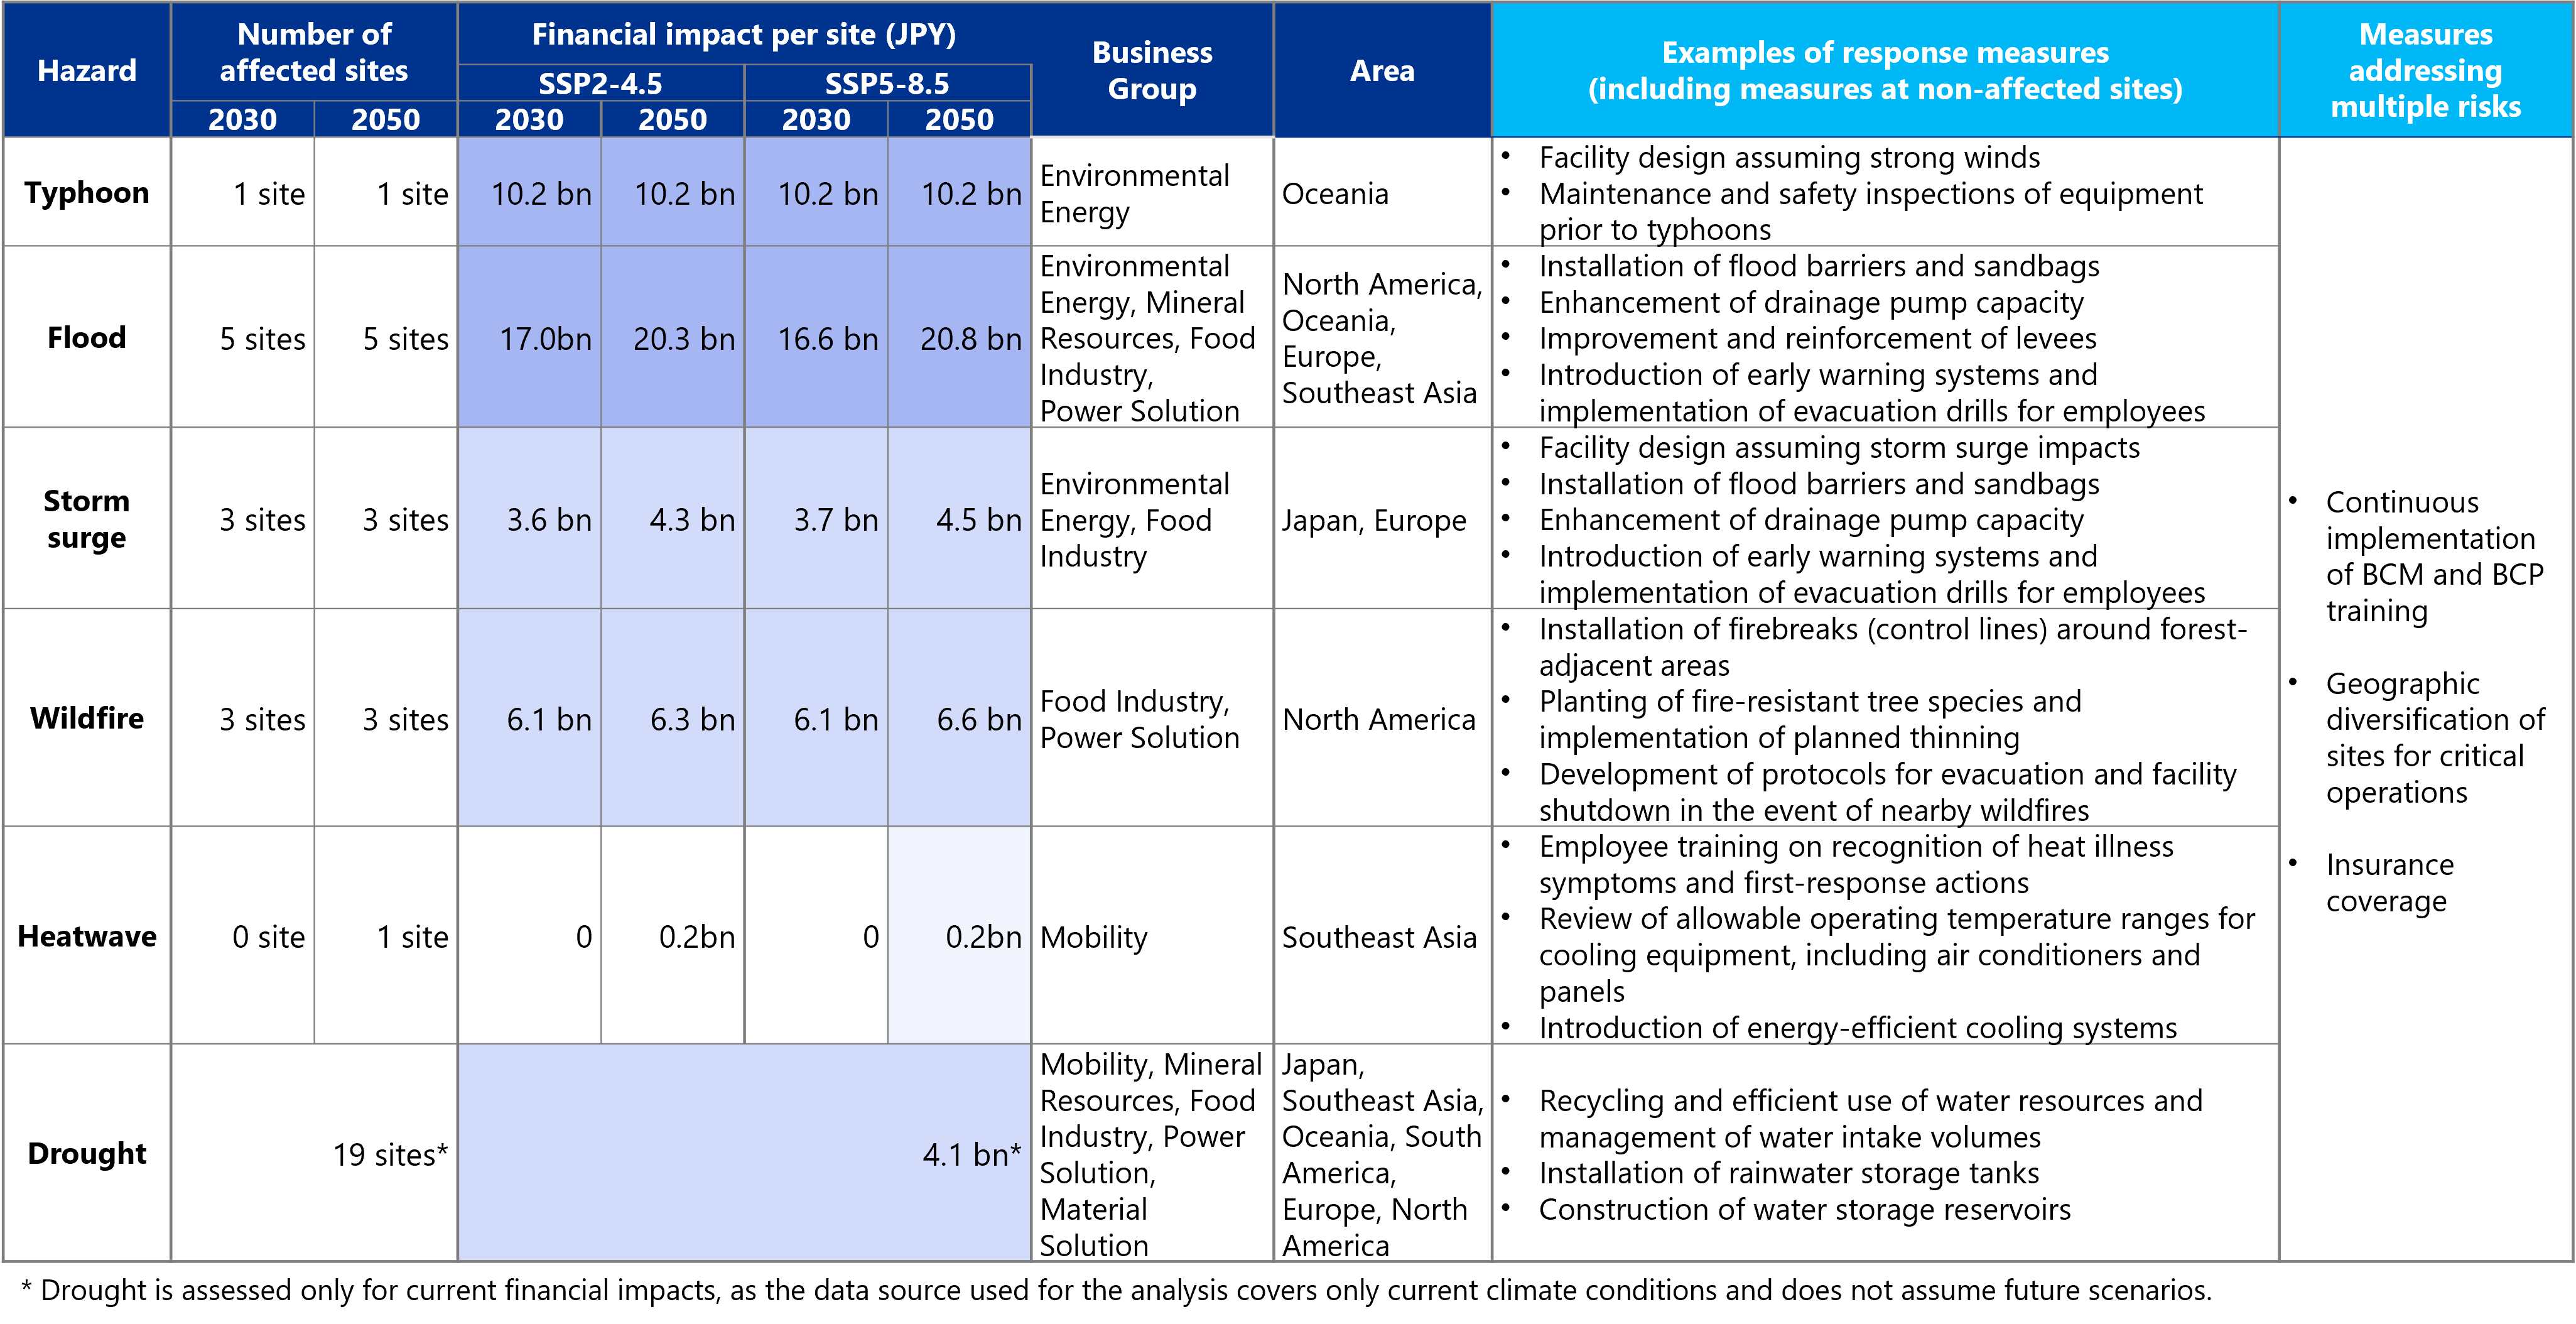
As a result of our physical risk analysis, we confirmed that a certain level of physical risk arising from natural hazards, such as floods and windstorms, can be anticipated at our business sites and assets. However, taking into account the overall scale of our assets, revenues, and other factors, we recognize that, at this point, these impacts are not expected to have a material effect on our financial position or business continuity.
At many of our business sites, facility-level measures and operational preparedness for natural disasters have already been implemented, and a certain level of resilience to physical risks has been secured. In addition, beyond the sites included in this analysis, we maintain insurance coverage for natural disasters as appropriate, and for businesses and sites with high financial materiality, we have established and implemented Business Continuity Plans (BCP) in accordance with Business Continuity Management (BCM) principles.
Involvement in LNG Projects, Equity Share of Oil and Gas Upstream Production
MC’s equity share of oil and gas upstream production is as shown in the data below. GHG emissions from burning natural gas relatively lower compared to when burning other fossil fuels, and the demand for natural gas is forecasted to grow in line with the transition to a low-carbon and decarbonized society. Accordingly, MC has positioned natural gas as a core business. Currently, natural gas accounts for approximately 85% of MC’s equity share of oil and gas production.
Please refer to the ESG Data at link below for data on Involvement in LNG Projects, Equity Share of Oil and Gas Upstream Production.
Renewable Energy Businesses
Please refer to the ESG Data at link below for data on Renewable Energy Businesses.