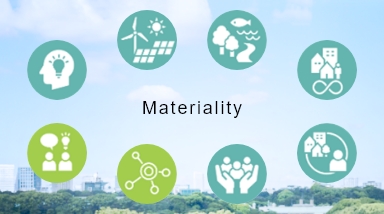
Basic Data
Employee Data (as of March 31 of each fiscal year)
FY2016 | FY2017 | FY2018 | FY2019 | FY2020 | |
---|---|---|---|---|---|
Number of employees (consolidated) |
77,164 | 77,476 | 79,994 | 86,098 | 82,997 |
Number of employees (non-consolidated) |
6,233 | 6,129 | 6,016 | 5,882 | 5,725 |
Male | 4,629 ( 74.27% ) |
4,535 ( 73.99% ) |
4,437 ( 73.75% ) |
4,356 ( 74.06% ) |
4,241 ( 74.08% ) |
Female | 1,604 ( 25.73% ) |
1,594 ( 26.01% ) |
1,579 ( 26.25% ) |
1,526 ( 25.94% ) |
1,484 ( 25.92% ) |
Average age of employees (non-consolidated) |
42.5 | 42.6 | 42.5 | 42.6 | 42.7 |
Male | 42.6 | 42.7 | 42.7 | 42.8 | 42.9 |
Female | 42.2 | 42.3 | 42.3 | 42.2 | 42.1 |
Average years of service (non-consolidated) |
18.4 | 18.4 | 18.4 | 18.4 | 18.4 |
Male | 18.4 | 18.4 | 18.3 | 18.4 | 18.5 |
Female | 18.5 | 18.5 | 18.5 | 18.4 | 18.2 |
Number of employees on overseas assignments (including global trainees*) (non-consolidated) |
1,286 | 1,288 | 1,261 | 1,174 | 1,075 |
Male | 1,223 ( 95.10% ) |
1,217 ( 94.49% ) |
1,199 ( 95.08% ) |
1,101 ( 93.78% ) |
1,019 ( 94.79% ) |
Female | 63 ( 4.90% ) |
71 ( 5.51% ) |
62 ( 4.92% ) |
65 ( 5.54% ) |
56 ( 5.21% ) |
*The “Global Trainee Program” is an overseas assignment system aimed at young employees, in order to handle the global development of MC's business portfolio and strengthen MC's global competitiveness in terms of human resources.
Breakdown of Employee Data (as of March 31)
(Unit:persons)
FY2020 | |
---|---|
Number of employees by organization (non-consolidated) | 5,725 |
Corporate Staff Section | 898 |
Natural Gas Group | 362 |
Industrial Materials Group | 422 |
Petroleum & Chemicals Solution Group | 503 |
Mineral Resources Group | 360 |
Industrial Infrastructure Group | 320 |
Automotive & Mobility Group | 478 |
Food Industry Group | 584 |
Consumer Industry Group | 619 |
Power Solution Group | 322 |
Urban Development Group | 378 |
MC Offices and Subsidiaries | 479 |
Number of employees by region (non-consolidated) | 5,725 |
Japan | 4,630 |
North America | 206 |
Latin America & the Caribbean | 64 |
Europe | 162 |
Africa | 15 |
Middle East | 37 |
Asia & Oceania | 496 |
East Asia | 115 |
Number of Professional Staff, Managers, Executives (non-consolidated) (as of April 1 of each fiscal year)
(Unit:persons)
FY2017 | FY2018 | FY2019 | FY2020 | FY2021 | |
---|---|---|---|---|---|
Professional staff | 5,839 | 5,722 | 5,604 | 5,476 | 5,335 |
Male | 4,649 ( 79.62% ) |
4,535 ( 79.26% ) |
4,441 ( 79.25% ) |
4,362 ( 79.66% ) |
4,256 ( 79.78% ) |
Female | 1,190 ( 20.38% ) |
1,187 ( 20.74% ) |
1,163 ( 20.75% ) |
1,114 ( 20.34% ) |
1,079 ( 20.22% ) |
Managers | 3,972 | 3,949 | 3,906 | 3,860 | 3,805⋆ |
Male | 3,598 ( 90.58% ) |
3,539 ( 89.62% ) |
3,476 ( 88.99% ) |
3,433 ( 88.94% ) |
3,367⋆ ( 88.49% ) |
Female | 374 ( 9.42% ) |
410 ( 10.38% ) |
430 ( 11.01% ) |
427 ( 11.06% ) |
438⋆ ( 11.51% ) |
Executive officers | 49 | 49 | 43 | 50 | 49 |
Male | 49 ( 100.00% ) |
49 ( 100.00% ) |
43 ( 100.00% ) |
50 ( 100.00% ) |
49 ( 100.00% ) |
Female | 0 ( 0.00% ) |
0 ( 0.00% ) |
0 ( 0.00% ) |
0 ( 0.00% ) |
0 ( 0.00% ) |
Directors/audit & supervisory board members* | 18 | 18 | 18 | 16 | 16 |
Male | 16 ( 88.89% ) |
16 ( 88.89% ) |
16 ( 88.89% ) |
13 ( 81.25% ) |
13 ( 81.25% ) |
Female | 2 ( 11.11% ) |
2 ( 11.11% ) |
2 ( 11.11% ) |
3 ( 18.75% ) |
3 ( 18.75% ) |
*As of June 30.
Number of Hires (non-consolidated)
(Unit:persons)
FY2017 | FY2018 | FY2019 | FY2020 | FY2021 | |
---|---|---|---|---|---|
Number of new graduate entrants | 179 | 171 | 130 | 127 | 123 |
Male | 122 ( 68.16% ) |
109 ( 63.74% ) |
92 ( 70.77% ) |
89 ( 70.08% ) |
88 ( 71.54% ) |
Female | 57 ( 31.84% ) |
62 ( 36.26% ) |
38 ( 29.23% ) |
38 ( 29.92% ) |
35 ( 28.46% ) |
(Secretarial Staff)* | 20 | 17 | 7 | - | - |
Number of mid-career entrants | 6 | 8 | 13 | 21 | 16 |
Male | 4 ( 66.67% ) |
8 ( 100.00% ) |
12 ( 92.31% ) |
17 ( 80.95% ) |
13 ( 81.25% ) |
Female | 2 ( 33.33% ) |
0 ( 0.00% ) |
1 ( 7.69% ) |
4 ( 19.05% ) |
3 ( 18.75% ) |
Ratio of Mid-career recruitment * as of April 1, 2022 |
3% | 4% | 9% | 14% | 12% |
*Due to hiring postponements, there are no figures for secretarial staff in fiscal years 2020 and 2021.
Employment Rate of Persons with Impairments (as of June 1 of each fiscal year)
FY2017 | FY2018 | FY2019 | FY2020 | FY2021 | |
---|---|---|---|---|---|
Employment rate of persons with impairments* | 2.48% | 2.63% | 2.69% | 2.90% | 2.53%⋆ |
*Based on the total number of Mitsubishi Corporation (non-consolidated), its special-purpose subsidiary, Mitsubishi Shoji & Sun Co., Ltd., and its three Group certified companies.
Number of Employees Using MC's Systems (non-consolidated) (as of March 31 of each fiscal year)
(Unit:persons)
FY2016 | FY2017 | FY2018 | FY2019 | FY2020 | |
---|---|---|---|---|---|
Number of employees who took Paid Volunteer Leave | 163 | 116 | 181 | 138 | 10 |
Male | 86 | 53 | 88 | 69 | 2 |
Female | 77 | 63 | 93 | 69 | 8 |
Number of employees who took Paid Childbirth Leave | 100 | 83 | 96 | 98 | 88 |
Number of employees who took Maternity/Paternity Leave*1 | 35 | 66 | 58 | 72 | 84 |
Male | 3 | 14 | 13 | 20 | 36 |
Female | 32 | 52 | 45 | 52 | 48 |
Number of employees who took Paid Child Care Leave | 211 | 224 | 251 | 274 | 246 |
Male | 87 | 94 | 120 | 123 | 82 |
Female | 124 | 130 | 131 | 151 | 164 |
Number of employees who took Paid School Events Leave | 252 | 265 | 281 | 299 | 189 |
Male | 121 | 123 | 138 | 139 | 84 |
Female | 131 | 142 | 143 | 160 | 105 |
Number of employees who shortened work hours for child care | 72 | 73 | 82 | 91 | 67 |
Male | 1 | 0 | 2 | 1 | 0 |
Female | 71 | 73 | 80 | 90 | 67 |
Number of employees who took Family Care Leave*1 | 4 | 1 | 4 | 1 | 1 |
Male | 1 | 0 | 0 | 0 | 1 |
Female | 3 | 1 | 4 | 1 | 0 |
Number of employees who took Paid Family Care Leave | 196 | 225 | 247 | 271 | 269 |
Male | 59 | 71 | 68 | 78 | 75 |
Female | 137 | 154 | 179 | 193 | 194 |
Number of employees who applied for the “re-employment system for employees who left to accompany spouses' domestic or international transfers”*2 | 10 | 10 | 6 | 14 | 10 |
*1. The number of employees who began taking the type of leave during each fiscal year.
*2. The “re-employment system for employees who left to accompany spouses' domestic or international transfers” refers to a system in which re-employment is offered, under certain conditions, to employees who resign their positions in order to accompany their spouse to location of dometic or international transfer.
Occupational Health and Safety Data (consolidated) (as of March 31 of each fiscal year)
Work related Frequency rate*
(This data includes Subsidiaries and Unincorporated Joint operations, which contains production business sites)
FY2019 | FY2020 | |
---|---|---|
①Employees | 5.61 | 4.16⋆ |
②Non-employees workers (Contractors) | 2.16 | 1.95⋆ |
Whole company (①+②) |
5.06 | 3.79 |
Work related Frequency rate*
(This data includes Subsidiaries and Unincorporated Joint operations, any other group companies like Affiliates, which contains production business sites)
FY2019 | FY2020 | |
---|---|---|
①Employees | 3.19 | 3.36 |
②Non-employees workers (Contractors) | 1.22 | 0.75 |
Whole copmany (①+②) |
2.71 | 2.74 |
* “Frequency rate” refers to the frequency of workplace accidents and is derived from the number of injuries/deaths resulting from workplace accidents per 1,000,000 actual working hours.
Occupational Health and Safety Data (non-consolidated) (as of March 31 of each fiscal year)
FY2017 | FY2018 | FY2019 | FY2020 | |
---|---|---|---|---|
Lost time injuries frequency rate* (Frequency rate of injuries, people/million hrs) |
0.46 | 0.47 | 0.49 | 0.16⋆ |
Lost time injuries severity rate* (Severity level of accidents, days/thousand hrs) |
0.01 | 0.00 | 0.01 | 0.00⋆ |
Occupational illness frequency rate* (Frequency of industrial accidents classified as work-related illnesses as stipulated by the Japanese Ministry of Health, Labour and Welfare (including fatalities caused by illness, people/million hrs)) |
0.00 | 0.00 | 0.00 | 0.00⋆ |
*
Calculated based on the standards of the Japanese Ministry of Health, Labour and Welfare for employees working at head offices and domestic branches (excluding advisors and contract employees).
“Frequency rate” refers to the frequency of workplace accidents and is derived from the number of injuries/deaths resulting from workplace accidents per 1,000,000 actual working hours.
“Injuries/deaths” refers to workplace accidents resulting in both physical injury or loss of physical function as well as one or more days of absence from work.
“Severity rate” refers to the severity level of accidents and represents the total number of lost time injury days / 1,000 total actual working hours.
(Reference) Comparison with Industry Average (for Wholesalers and Retailers with a Business Scale of 100 Employees or More)(From the Japanese Ministry of Health, Labour and Welfare's “2020 Survey on Industrial Accidents”).
Lost time injuries frequency rate : 2.27
Workplace accident severity rate : 0.11
Other Data Concerning Employees (non-consolidated)
FY2020 | |
---|---|
Average Salary | 16,783,874 yen |
Annual average actual working hours*1 | 1984.3 hrs. |
Monthly average overtime hours*1 | 27.2 hrs. |
Percentage of annual paid leave days taken*2 | 55% |
Voluntary turnover rate (Compared to the number of employees as of March 31, 2021) |
1.4% |
Number of labor union members*3 | 3,090 |
Level of employee satisfaction*4 | 76% |
*1. Employees at head office and Japanese branches (excluding managers, corporate advisers and contract employees).
*2. Employees at head office and Japanese branches (excluding secondees from other companies).
*3. As of March 31, 2021.
*4. Employee Awareness Surveys are taken every three years. The last survey was taken in the fiscal year ended March 31, 2020 to obtain a snapshot of employee motivation and organizational vitality. The findings are used to improve management and other aspects of operations. Employee satisfaction figures represent the ratio of staff members responding positively to questions about employee engagement (Do you work with enthusiasm and take pride in/admire your company?) in the survey.
Independent Practitioner's Assurance
Independent Practitioner's Assurance Report (PDF:231KB)
*Independent Practitioner's Assurance Report conducted by Deloitte Tohmatsu Sustainability Co., Ltd.
Applicable to the data marked with ⋆ for the year ended March, 2021 and the year ended March, 2022 on the “Human Resource Management / Basic Data” of this website.